
")
Population and study design
The SCAPIS study is a Swedish nationwide population-based cohort mainly designed to research cardiovascular and chronic obstructive pulmonary diseases. Between 2013 and 2018, 30,154 men and women aged 50 to 65 were recruited from a random population sample by six Swedish university hospitals (Gothenburg, Linköping, Malmö/Lund, Stockholm, Umeå, and Uppsala). The primary aim of SCAPIS is to improve the risk prediction of cardiopulmonary diseases and optimize the ability to study disease mechanisms9.
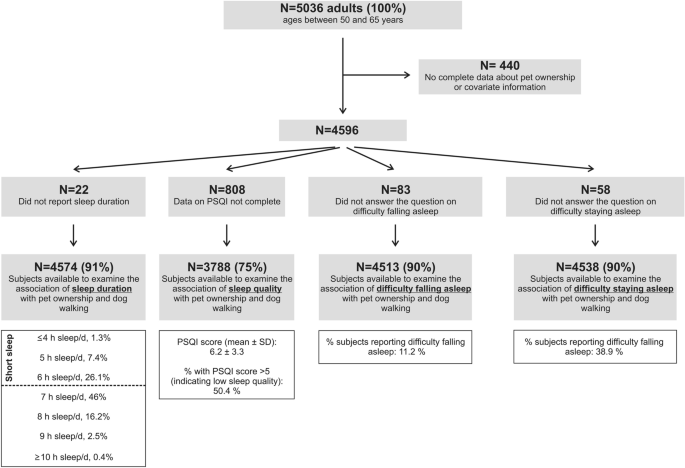
In addition to surveying the general health status and lifestyle habits, all Uppsala participants (but not the other areas) were also asked about pet ownership (see below). Following exclusions (detailed in Fig. 1), data from 4,574 subjects from the Uppsala cohort were available to examine the association between pet ownership and sleep duration, 3788 subjects for the sleep quality analysis, 4513 subjects for the difficulty falling asleep analysis, and 4538 subjects for the difficulty staying asleep analysis, respectively. The Regional Ethical Review Board in Uppsala (Etikprövningsmyndigheten Uppsala; approval number DNR2019-05343) approved the study, and all participants provided written informed consent. All investigations were conducted in accordance with the Declaration of Helsinki.
Exposure—pet ownership
Pet ownership was assessed by the question: “Do you have a pet in the household?”. Participants could answer with “yes”, “no”, or “I can’t or don’t want to answer”. The answer “I can’t or don’t want to answer” was treated as missing data. If answering yes to the pet ownership question, participants could fill in which and how many pets they had, divided into “dog”, “cat”, “rabbit”, “bird”, or “other”. Dog owners were also asked about their dog walking engagement. Possible answer options were: “I mainly take care of the dog’s daily exercise”, “I take care of about half of the dog’s daily exercise”, “I take care of a small part of the dog’s daily exercise”, “I have no dog”, and “I can’t or don’t want to answer”. Dog owners who chose the answer options “I have no dog” or “I can’t or don’t want to answer” were treated as non-dog owners in the analysis regarding the association between dog walking and sleep.
Outcome—sleep
Participants were asked, “How many hours do you normally sleep during a day” with the following answer options: “4 h or less per day”; “5 h per day”; “6 h per day”; “7 h per day”; “8 h per day”; “9 h per day”; and “10 or more hours per day”. In the present analysis, “7 h” or more were classified as achieving the recommended daily sleep duration. Note that this question was part of the SCAPIS core questionnaire, i.e., it did not derive from the PSQI where the respondent is typically asked several questions regarding sleep, including a question on how many hours (s)he habitually slept during the past month.
Participants’ sleep quality was measured using the PSQI5. As described elsewhere, the PSQI surveys various sleep characteristics during the past month, such as sleep latency (i.e., how long it takes to fall asleep). Each item is scored on a 0–3 interval scale (0 = not during the past month; 1 = Less than once a week; 2 = once or twice a week; and 3 = Three or more times a week). The answer “Three or more times a week” to these questions was classified as having this sleep problem. Overall, a score of > 5 defines poor sleep quality5.
In SCAPIS, participants could also choose the answer option “I can’t or don’t want to answer” when answering the PSQI components. This answer option does typically not exist in the PSQI5. To ensure that our results can be compared with past and future investigations using the PSQI, participants who answered any questions of the PSQI with “I can’t or don’t want to answer” were excluded from the analysis.
The PSQI questions “During the past month, how often have you had trouble sleeping because you cannot get to sleep within 30 min?” and “During the past month, how often have you had trouble sleeping because you wake up in the middle of the night or early morning?” were used in a separate analysis to evaluate whether pet ownership associated with difficulty falling and difficulty staying asleep, respectively. The answer “Three or more times a week” to these questions was classified as having this sleep problem.
Confounders
We applied d-separation criteria on directed acyclic graphs (DAGs; see ref.10) to identify potential confounders to include in the regression model (see Supplementary Figure S1). DAGs is a widely used method to depict graphically assumed causal relationships between predictor, outcome, and confounder variables.
For the analysis, education was divided into university degree vs no university degree. A high level of social interaction was defined as meeting more than two close friends every week. Physical activity status was divided into ≥ 2 h of modest to heavy exercise/week vs < 2 h of modest to heavy exercise/week. Alcohol consumption frequency was divided into ≥ 2 times/week vs < 2 times per week. The following question assessed socio-economic stability: “Could you raise 20,000 SEK within a week if required?” (answer options: yes, no). Furthermore, subjects reported whether they work night shifts, have been diagnosed with sleep apnea, experienced a high-stress load during the past 12 months (yes, no), and if they currently smoke. Some questions also had the response option “I can’t or don’t want to answer”. Hence, these confounders were entered as variables with three answer options into the analysis. Diabetes was either confirmed by questionnaire (yes, no) or when participants without previously known diabetes had a blood glucose level of at least 7 mmol/l or an HbA1c level of at least 48 mmol/mol. The weight and height were measured during the physical SCAPIS examination and used to calculate BMI. Age was recorded at the time of the examination.
Statistical analysis
All analyses were performed using IBM SPSS Statistics 24 (SPSS Inc. Chicago, IL, USA). Logistic regression was used to investigate the association of pet ownership (any pet, dogs, or cats) and dog walking with sleep. Results from adjusted (including all confounders described above) logistic regressions are reported. Overall, a P value < 0.05 was considered significant.
link


More Stories
Animal Lovers League to leave premises by Feb, other groups to take over its 160 animals
Nuclear imaging groups share new flurpiridaz guideline
Only Two Groups Have Submitted Signatures for 2026 Ballot Initiatives. They Aim at Very Different Issues.