
GWAS analysis using color as the dependent phenotype
Genotyping data and color phenotypes were available for 209 SKK registered Labrador retrievers consisting of 205 females and 4 males (supplementary file S1). As a proof of concept, we performed a GWAS analysis using color as the dependent variable. This was performed to confirm that known genetic loci could be identified using this dataset and to show that the linear mixed model was able to correct for population structure and data inflation. We evaluated the population structure within the genotyped dogs by drawing a multidimensional scaling (MDS) plot depicting the two first dimensions (C1 and C2) and reflecting the color phenotype for each individual dog (Supplementary Fig. S1). The MDS plot showed that there is some population structure within the genotyped dogs with an unequal distribution of the brown phenotype across the dimensions.
We performed two separate GWAS analyses using color as the dependent phenotype. The first analysis compared black versus yellow dogs. This analysis included 148 black and 38 yellow Labrador retrievers with 115,072 SNPs passing data filtering. A basic association test correctly identified the MCR1 locus on chromosome 5 as the most associated locus (chr5: 62,870,500, pBlack/yellow = 1.4 × 10⁻²²), however, the results were inflated with a lambda value of \(\uplambda\)=1.39, as seen on the QQ-plot (Supplementary Fig. S2a and b). A subsequent analysis, using a linear mixed model, corrected for the data inflation with a resulting lambda value of \(\uplambda\) =0.96 and also correctly identified the MCR1 locus (chr5:64,358,997, pBlack/yellow = 1.49 × 10⁻²⁸), (Supplementary Fig. S2c and d).
The second analysis was performed comparing 148 black against 22 brown Labrador retrievers. A basic association test correctly identified the TYRP1 locus as the most associated locus (chr11:33,578,561, pblack/brown = 1.8 × 10–38). However, the results were inflated with a lambda value of \(\uplambda\) =3.06, as visualized on the QQ-plot (Supplementary Fig. S3a,b). Applying a linear mixed model resulted in a mild overcorrection of the inflation with a lambda value of \(\uplambda\) = 0.90 with the most associated locus (chr11:33,578,561, pblack/brown = 7.0 × 10–40) still being identified as the TYRP1 locus (Supplementary Fig. S3c,d).
The “chip heritability”, i.e. the percentage of the phenotypic variation, that could be explained by the genetic variation in the genotyping data (PVE), was calculated for each trait using GEMMA31. This resulted in PVEblack/yellow = 0.96 +/− 0.16(SE) and the PVEblack/brown = 0.93 +/− 0.12(SE), which is in alignment with expectations for the inheritance of these color traits32.
Having showed that the linear mixed model was able to correct for genomic inflation, whilst correctly identifying the color loci, we applied this analytical method to analyze our data with HD grading and body weight as the dependent variables.
GWAS analysis using the numerical HD score as the dependent variable
Genotyping data and matched numerically translated HD scores, as described in the materials and methods, were available for 209 SKK registered Labrador retrievers representing 205 females and 4 males. All individuals and 114,854 SNPs passed the quality control and filtering. An MDS plot showing the two first dimensions (C1 and C2), reflecting the numerical translated score of the included dogs, is shown in Fig. 1a together with a summary of the scores (Fig. 1b). As previously observed, the MDS plot shows some evidence of population structure that could affect the analytical process. A basic GWAS association test was performed in PLINK using the numerically translated HD value as the dependent continuous variable33. The analysis identified the strongest association to a locus on chromosome 24, with some degree of data inflation reflected in the QQ-plot and the lambda value \(\uplambda\) =1.31 (Fig. 2a,b). A linear mixed model was applied correcting for the inflation, yielding a lambda value of \(\uplambda\) =1.05 (Fig. 2c). A single significant locus was identified on chromosome 24, represented by five significantly associated SNPs, reaching the LD-corrected Bonferroni threshold (Fig. 2d, supplementary Table 1). The three strongest associated SNPs (chr24:25,406,999, chr24:25,417,878, chr24:25,465,028) were equally associated (pHD = 4.3 × 10⁻⁷), in complete LD (R2 = 1.0), and are located within the NDRG3 gene (Fig. 2e,f). One of these SNPs at chr24:25,465,028 is positioned in the splice donor position -3 of exon 4 in NDRG3. When evaluating the LD structure surrounding the most associated SNPs we found a 0.7 MB locus (chr24:24,945,587–25,656,879) in high LD (R2 > 0.8) with the most associated SNPs. This region encodes multiple candidate genes (EPB41L1, AAR2, DLGAP4, MYL9, TGIF2, ENSCAFG00000029848, NDRG3, DSN1, SOGA1, C20orf118 and SAMHD1) and the locus has previously been associated with HD in a GWAS performed in German shepherds and in a targeted study validating selected HD associated SNPs in Labrador retrievers22,34. A list of nominally significant loci was generated based on deviation from the expected p-value (supplementary file S2).
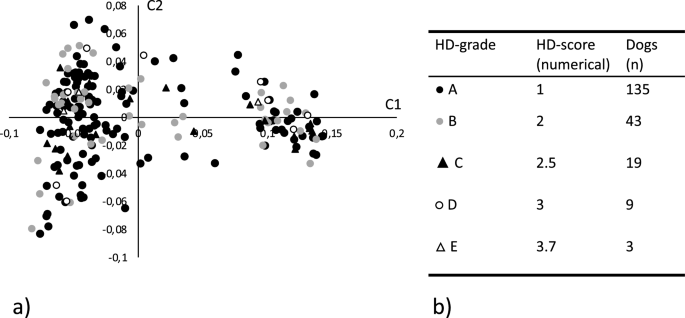
(a) Multidimensional scaling plot showing the genetic distance between the 209 genotyped Labrador retrievers in a two-dimensional space. Each datapoint represents an individual dog and the shape and color of the datapoint reflects the hip dysplasia (HD) score for the individual. Filled circle Represents individuals with grade A HD score (Normal hip score A). Grey circle represents individuals with grade B HD score (Normal hip score B). Filled triangle Represents individuals with grade C HD score (Mild hip dysplasia). Open circle Represents individuals with grade D HD score (Moderate hip dysplasia). Open triangle \(\uprho\) represents individuals with grade E HD score (Severe hip dysplasia). (b) Summary of the actual and numerically translated HD score and the number of individuals in each category of the study population.

GWAS analysis based on hip dysplasia scores in 209 Labrador retrievers. (a) QQ-plot showing the expected versus the observed p-value from the basic association test. (b) Manhattan plot showing the genetic position across the 39 chromosomes versus the −log10 transformed p-value from the basic association test. (c) QQ-plot showing the expected versus the observed p-value from the linear mixed model association test. (d) Manhattan plot showing the genetic position across the 39 chromosomes versus the −log10 transformed p-value from the linear mixed model association test. The red line delineates the Bonferroni significance threshold. The blue line delineates a nominal significance threshold based on the deviation of the QQ-plot from the expected p-value. (e) LD plot reflecting the pairwise R2 between SNPs in a 2,000 kb window centered around the most associated SNP from association analysis. (f) Closer view of the associated locus on chromosome 24 reflecting the LD structure in relation to the most associated SNP (g) Annotated genome view of the area covering the three most associated SNPs on chromosome 24 which are in complete LD and are positioned within the coding and non-coding part of the NDRG3 gene.
The percentage of phenotypic variability explained by the dataset, as calculated by GEMMA, was PVEHD = 0.36 +/− 0.22(SE), which is in alignment with the previously reported heritability for HD in Labrador retrievers7. Body weight at the time of HD scoring was available for a subset of individuals n = 89. We examined if there was any difference in the body weight between the HD score groups however, we did not find any significant difference between groups p = 0.26 (Supplementary Fig. S4).
Evaluation of EBVHD in relation to the associated genotype on chromosome 24
Estimated breeding value is an indirect prediction of the genetic merit of a trait and can be used to predict the likelihood of an individual passing on a genetic trait to its offspring. The EBV for HD (EBVHD) was available for 205 of the 209 genotyped dogs. To validate the association between the identified risk genotype and HD status, we investigated if there was a difference in the EBVHD between different genotype groups (Fig. 4a). The EBVHD was compared between dogs that did not carry the risk allele and dogs that were either heterozygous or homozygous for the risk allele. As data was not normally distributed, as determined by a normality testing, Kruskal–Wallis and Dunn’s multiple comparison test was used to compare the EBVHD between groups. We found that there was a significant difference between the mean EBVHD in the groups (p = 0.003) (Table 1). When performing intergroup comparisons, we found that dogs that were homozygous for the risk allele had significantly lower (i.e. worse) EBVHD than dogs that did not carry the risk allele (p = 0.0023) or dogs that were heterozygous for the risk allele (p = 0.023) (Fig. 4a).

GWAS analysis based on the body weight of 85 female Labrador retrievers. (a) QQ-plot showing the expected versus the observed p-value from the basic association test. (b) Manhattan plot showing the genetic position across the 39 chromosomes versus the −log10 transformed p-value from the basic association test. (c) QQ-plot showing the expected versus the observed p-value from the linear mixed model association test. (d) Manhattan plot showing the genetic position across the 39 chromosomes versus the −log10 transformed p-value from the linear mixed model association test. The red line delineates the Bonferroni significance threshold. (e) Closer view of the associated locus on chromosome 10 reflecting the LD structure in relation to the most associated SNP (f) Closer view of the associated locus on chromosome 31 reflecting the LD structure in relation to the most associated SNP (g) Annotated genome view of the locus on chromosome 10 delimited by the most associated SNP and the two SNPs in highest LD with the associated SNP. (h) Annotated genome view of the area covered by the four most associated SNPs on chromosome 31 which are equally associated and in complete LD.
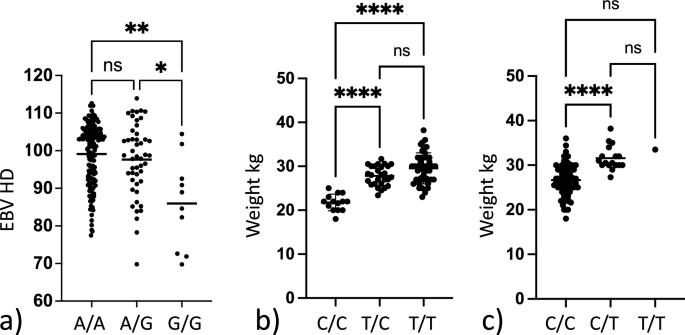
Box plots showing differences in phenotypic variables dependent on genotype. (a) Box plot showing the difference in mean estimated breeding value for HD (EBVHD) between dogs homozygous non risk (A/A) heterozygous risk (A/G) and homozygous risk (G/G) for the SNP chr24:25,406,999 associated with hip dysplasia. Significant difference is observed within the dataset. Group-wise comparison shows that homozygous risk individuals have a significantly lower (i.e. worse) EBVHD than other dogs. (b) Box plot showing the difference in mean body weight between dogs homozygous non risk (C/C) heterozygous risk (C/T) and homozygous risk (T/T) for the SNP chr10:48,367,568 associated with increased body weight. Significant difference is observed within the dataset. With group wise comparison homozygous non risk individuals have a significantly lower body weight than the other groups. (c) Box plot showing the difference in mean body weight between dogs being homozygous non risk (C/C) heterozygous risk (C/T) and homozygous risk (T/T) for the SNP chr31:1,938,609 associated with increased body weight. Significant difference is observed within the dataset. With group wise comparison homozygous non risk individuals have a lower body weight than heterozygous risk carriers. Not significant (ns) = p-value > 0.05, * = p-value ≤ 0.05, ** = p-value ≤ 0.01, *** = p-value ≤ 0.001, **** = p-value ≤ 0.0001.
GWAS analysis using body weight as the dependent phenotype
Body weight measured at the time of HD scoring was available for 89 dogs, 85 females and 4 males. As body weight differs significantly between males and females, we excluded the 4 males from the dataset to avoid an imbalanced sex bias24. To evaluate the effect of age on body weight, we performed a simple linear regression test comparing age and body weight. We did not find any correlation between increasing age and body weight (R2 = 0.0003 and p = 0.87 in the female dogs) (supplementary Fig. S5). We evaluated the population structure within the genotyped dogs by drawing an MDS plot depicting the two first dimensions (C1 and C2) and depicting dogs by weight groups. As previously seen the population structure is still observed in this smaller dataset (Supplementary Fig. S6). It is also noted that the weight categories are not equally distributed across the plot. GWAS analysis was performed using body weight as a continuous variable. After filtering and quality control, data from 85 dogs and 113,822 SNPs were included in the analysis. A basic association test was used to identify a locus on chromosome 10 as the most associated locus. However, the results were highly inflated with a lambda value of \(\uplambda\) =3.18 (Fig. 3a,b). A second analysis using a linear mixed model, markedly reduced the inflation and resulted in a lambda value of \(\uplambda\) =1.04. Two loci, on chr10:48,367,568, pBW = 4.5 × 10⁻⁷ and on chr31:1,938,609, pBW = 2.5 × 10⁻⁶, were identified with SNPs reaching the LD corrected Bonferroni threshold (Fig. 3c,d). The most associated SNP on chromosome 10 is located within an intron of the PRKCE gene, a gene previously linked to adipogenesis and body weight35,36. The locus on chromosome 10 is a narrow locus (Fig. 3e). The SNPs in highest LD with the locus defining SNP (R2 > 0.6) defines a 220 kb region containing the PRKCE and EPAS1 genes (Fig. 3g). The locus on chromosome 31 included four equally associated SNPs in complete LD (R2 = 1.0) covering a 180 kb region spanning the CADM2 gene (Fig. 3f,h), which is a gene that has been linked to obesity in multiple human studies looking at body composition in both children and adults37,38,39. In the NHGRI-EBI GWAS catalogue, BMI is listed as the most common trait associated with CADM240. Evaluation of the LD structure surrounding the SNP marking the locus, showed a 450 kb locus in high LD (R2 > 0.8) with CADM2 being the only gene located in the region.
The percentage of phenotypic variability explained by the dataset in relation to body weight, as calculated by GEMMA, was PVEWEIGHT = 0.94 + /- 0.31(SE).
Relationship between body weight and genotype for the two associated loci
To evaluate the effect of genotype on weight we performed a one-way ANOVA analysis evaluating the difference between body weight in relation to the genotype for the two associated loci. We found that there was a significant difference in mean weight between the genotype groups representing the two risk loci on chromosome 10 pBW10 = 3.2 × 10⁻¹² and chromosome 31 pBW31 = 2.4 × 10⁻⁶ (Table 1). Further, there was a significant difference in weight between dogs not carrying the risk allele on chromosome 10 and dogs being either heterozygous pCC/CT = 4.4 × 10⁻⁸ or homozygous pCC/TT = 6.7 × 10⁻¹¹ for the risk allele. A significant difference between the weight of dogs not carrying the risk allele and dogs being heterozygous for the risk allele on chromosome 31 pCC/CT = 3.5 × 10⁻⁶, was also found. However, only one dog was homozygous for the risk allele on chromosome 31 and hence no further meaningful statistical testing could be performed for homozygosity of this risk allele. Finally, a combined analysis was performed looking at the difference of body weight in dogs not carrying any risk alleles on chromosome 10 and chromosome 31 and dogs carrying different combinations of risk alleles for the two loci on chromosome 10 and chromosome 31 (Table 2 and Fig. 5). A statistically significant difference in body weight between dogs not carrying any risk alleles and dogs carrying any combination of risk alleles for the two associated loci on chromosome 10 and chromosome 31 was found.
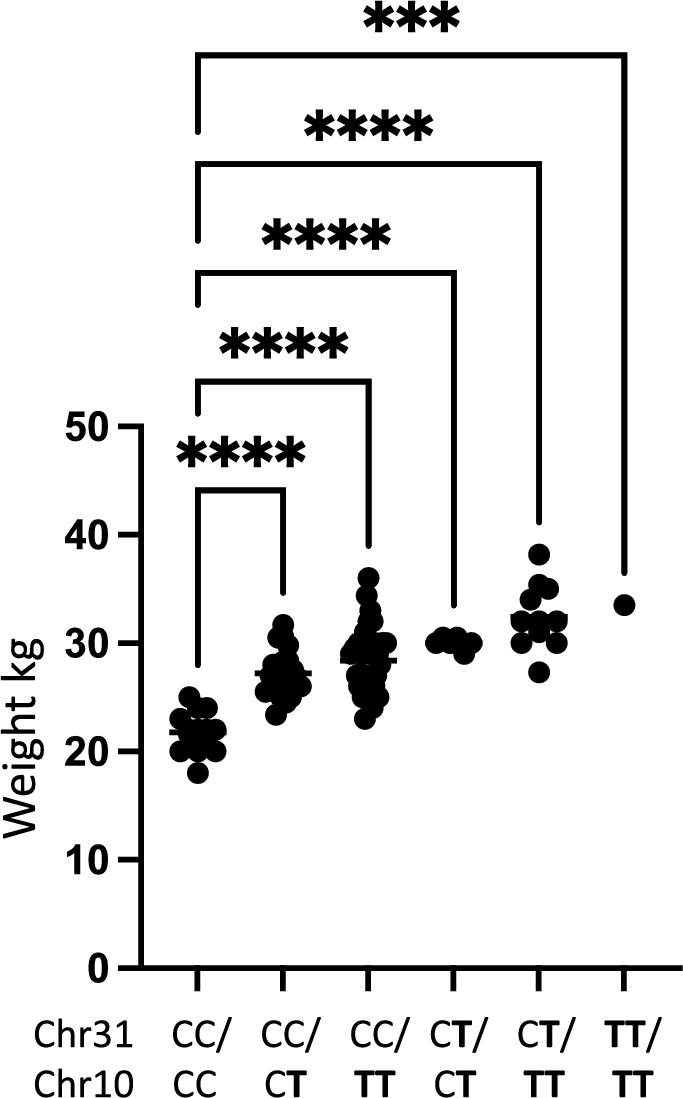
Boxplot illustrating the difference in weight between different groups. Labels indicate the genotype for the dogs in each group as reflected in Table 2 with T being the risk allele for each locus.
link


More Stories
Animal Lovers League to leave premises by Feb, other groups to take over its 160 animals
Nuclear imaging groups share new flurpiridaz guideline
Only Two Groups Have Submitted Signatures for 2026 Ballot Initiatives. They Aim at Very Different Issues.